
Metrics
Metrics give you visibility into your app’s health, request traffic, and response latency so you can spot regressions, debug performance issues, and confirm a deployment is healthy.
View Metrics
Section titled “View Metrics”- Navigate to your app in the dashboard.
- Select Metrics from the sidebar.
Metrics are scoped per app. Data starts appearing after your app’s first deployment, and request data appears after the first request reaches the app.
Available Metrics
Section titled “Available Metrics”The Metrics page has two sections:
- Application Health: CPU, memory, and replica health for your running app.
- Activity (Beta): Pro metrics for request volume, response latency, and HTTP paths.
Application Health
Section titled “Application Health”Application Health metrics are available on all plans.
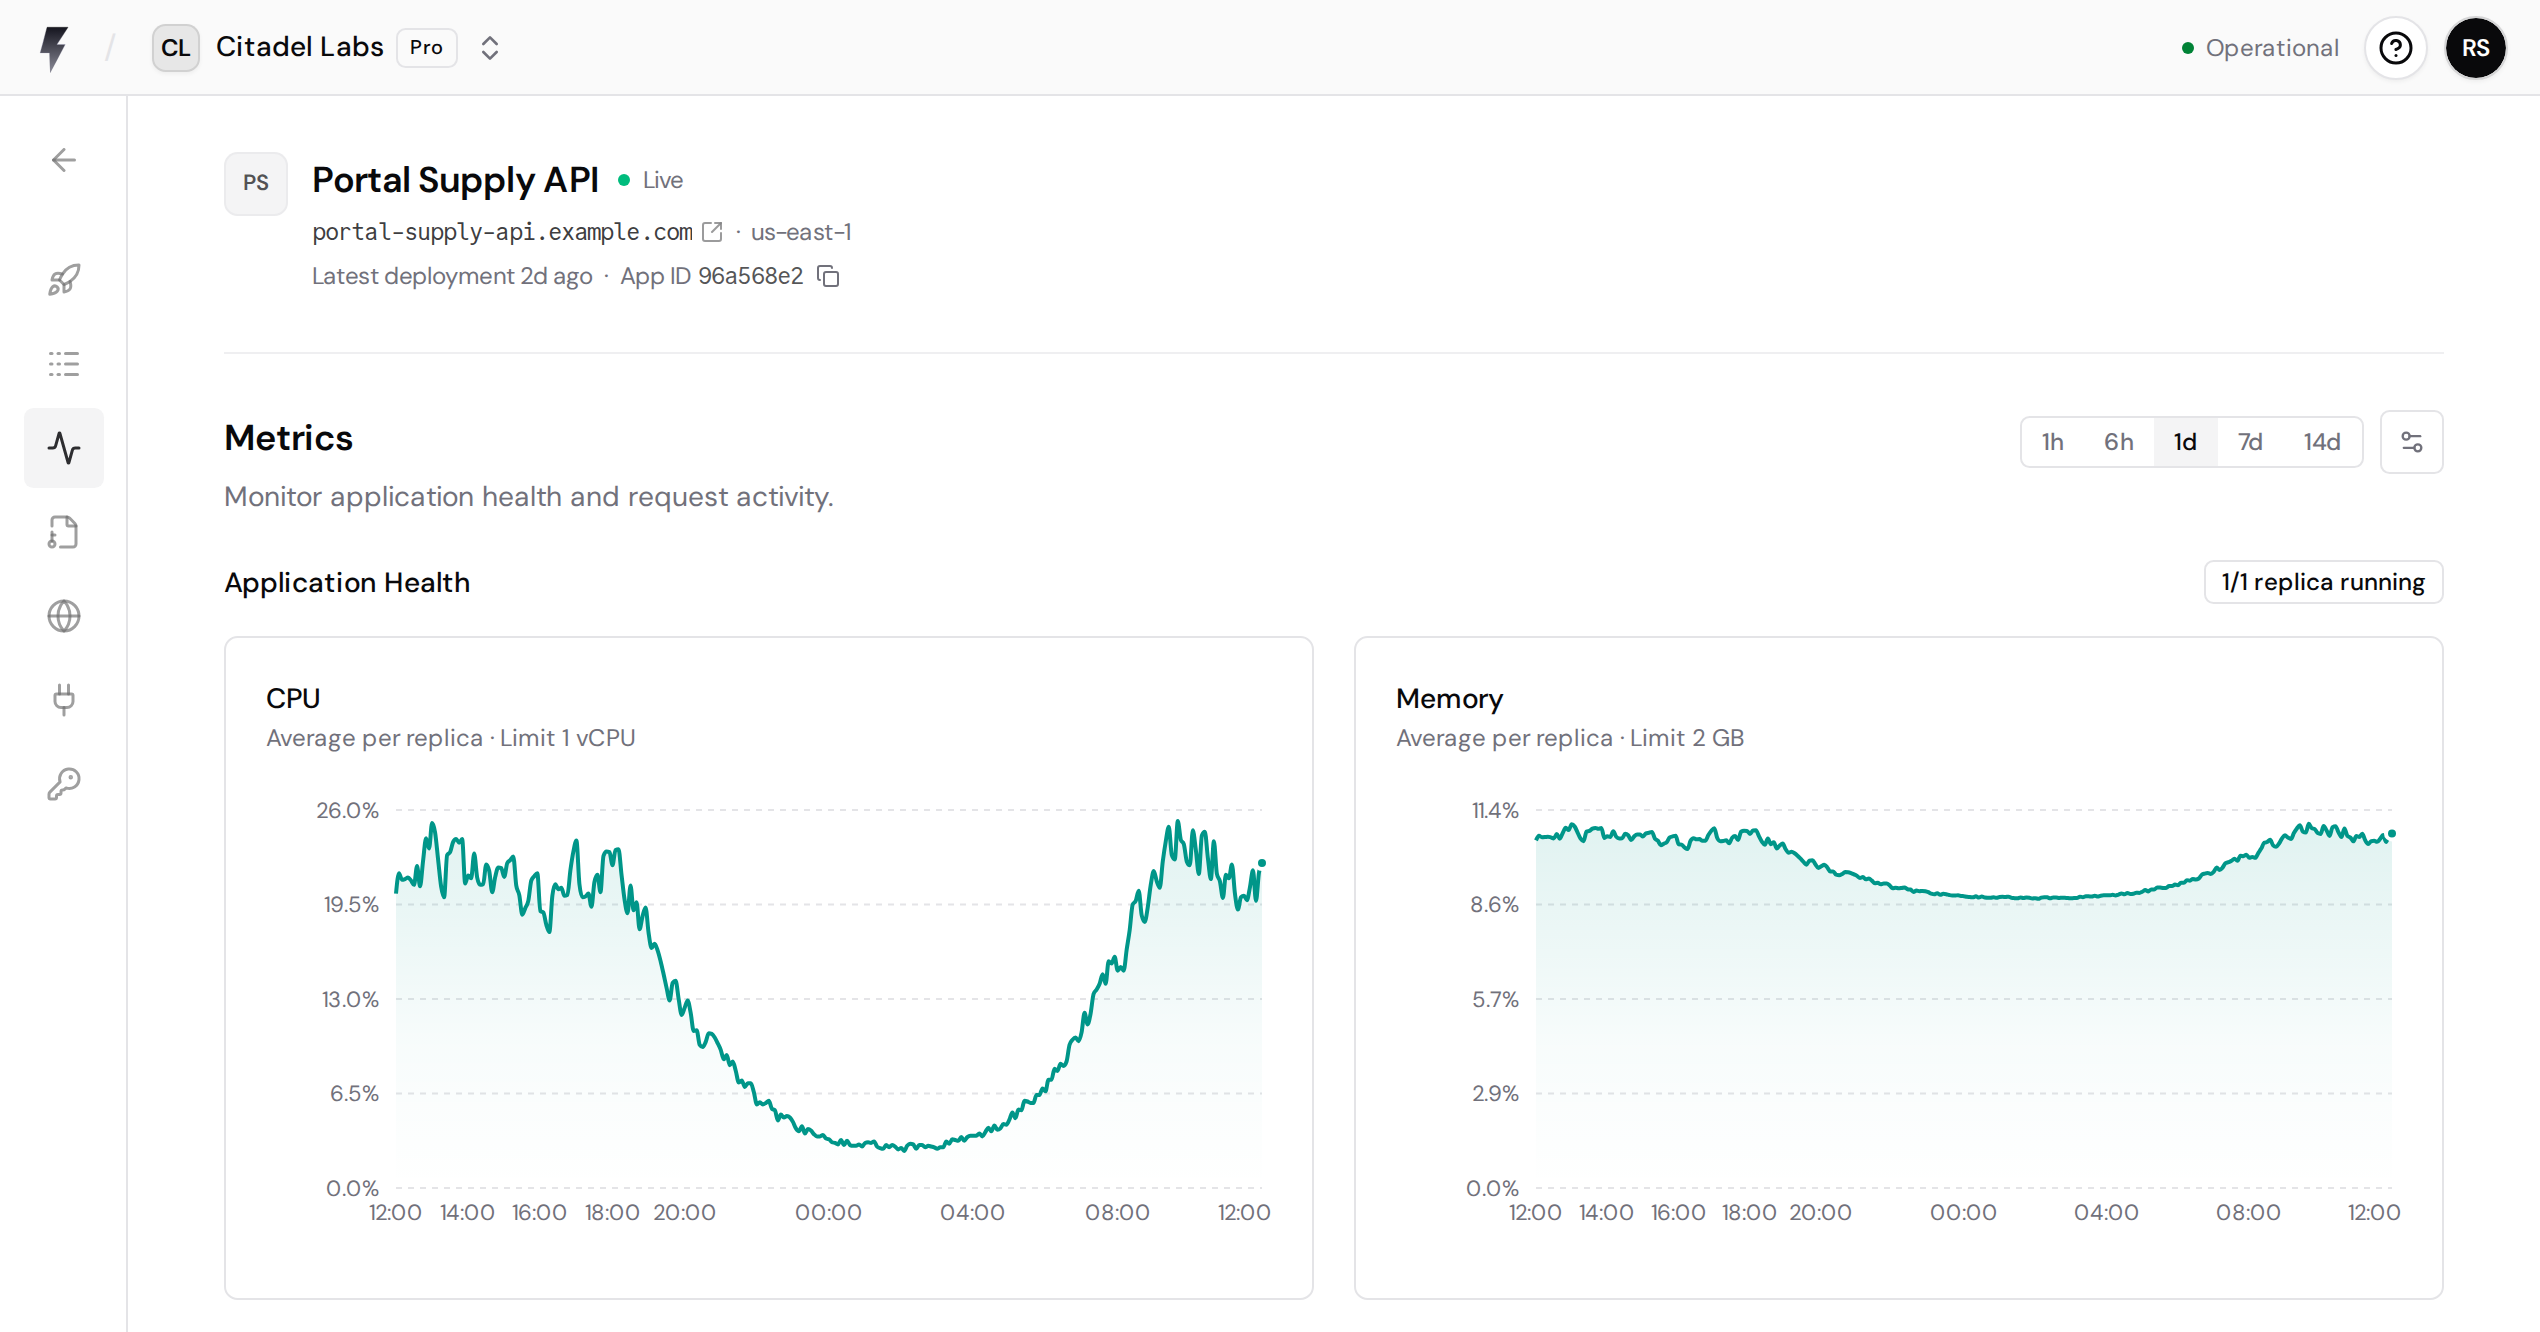
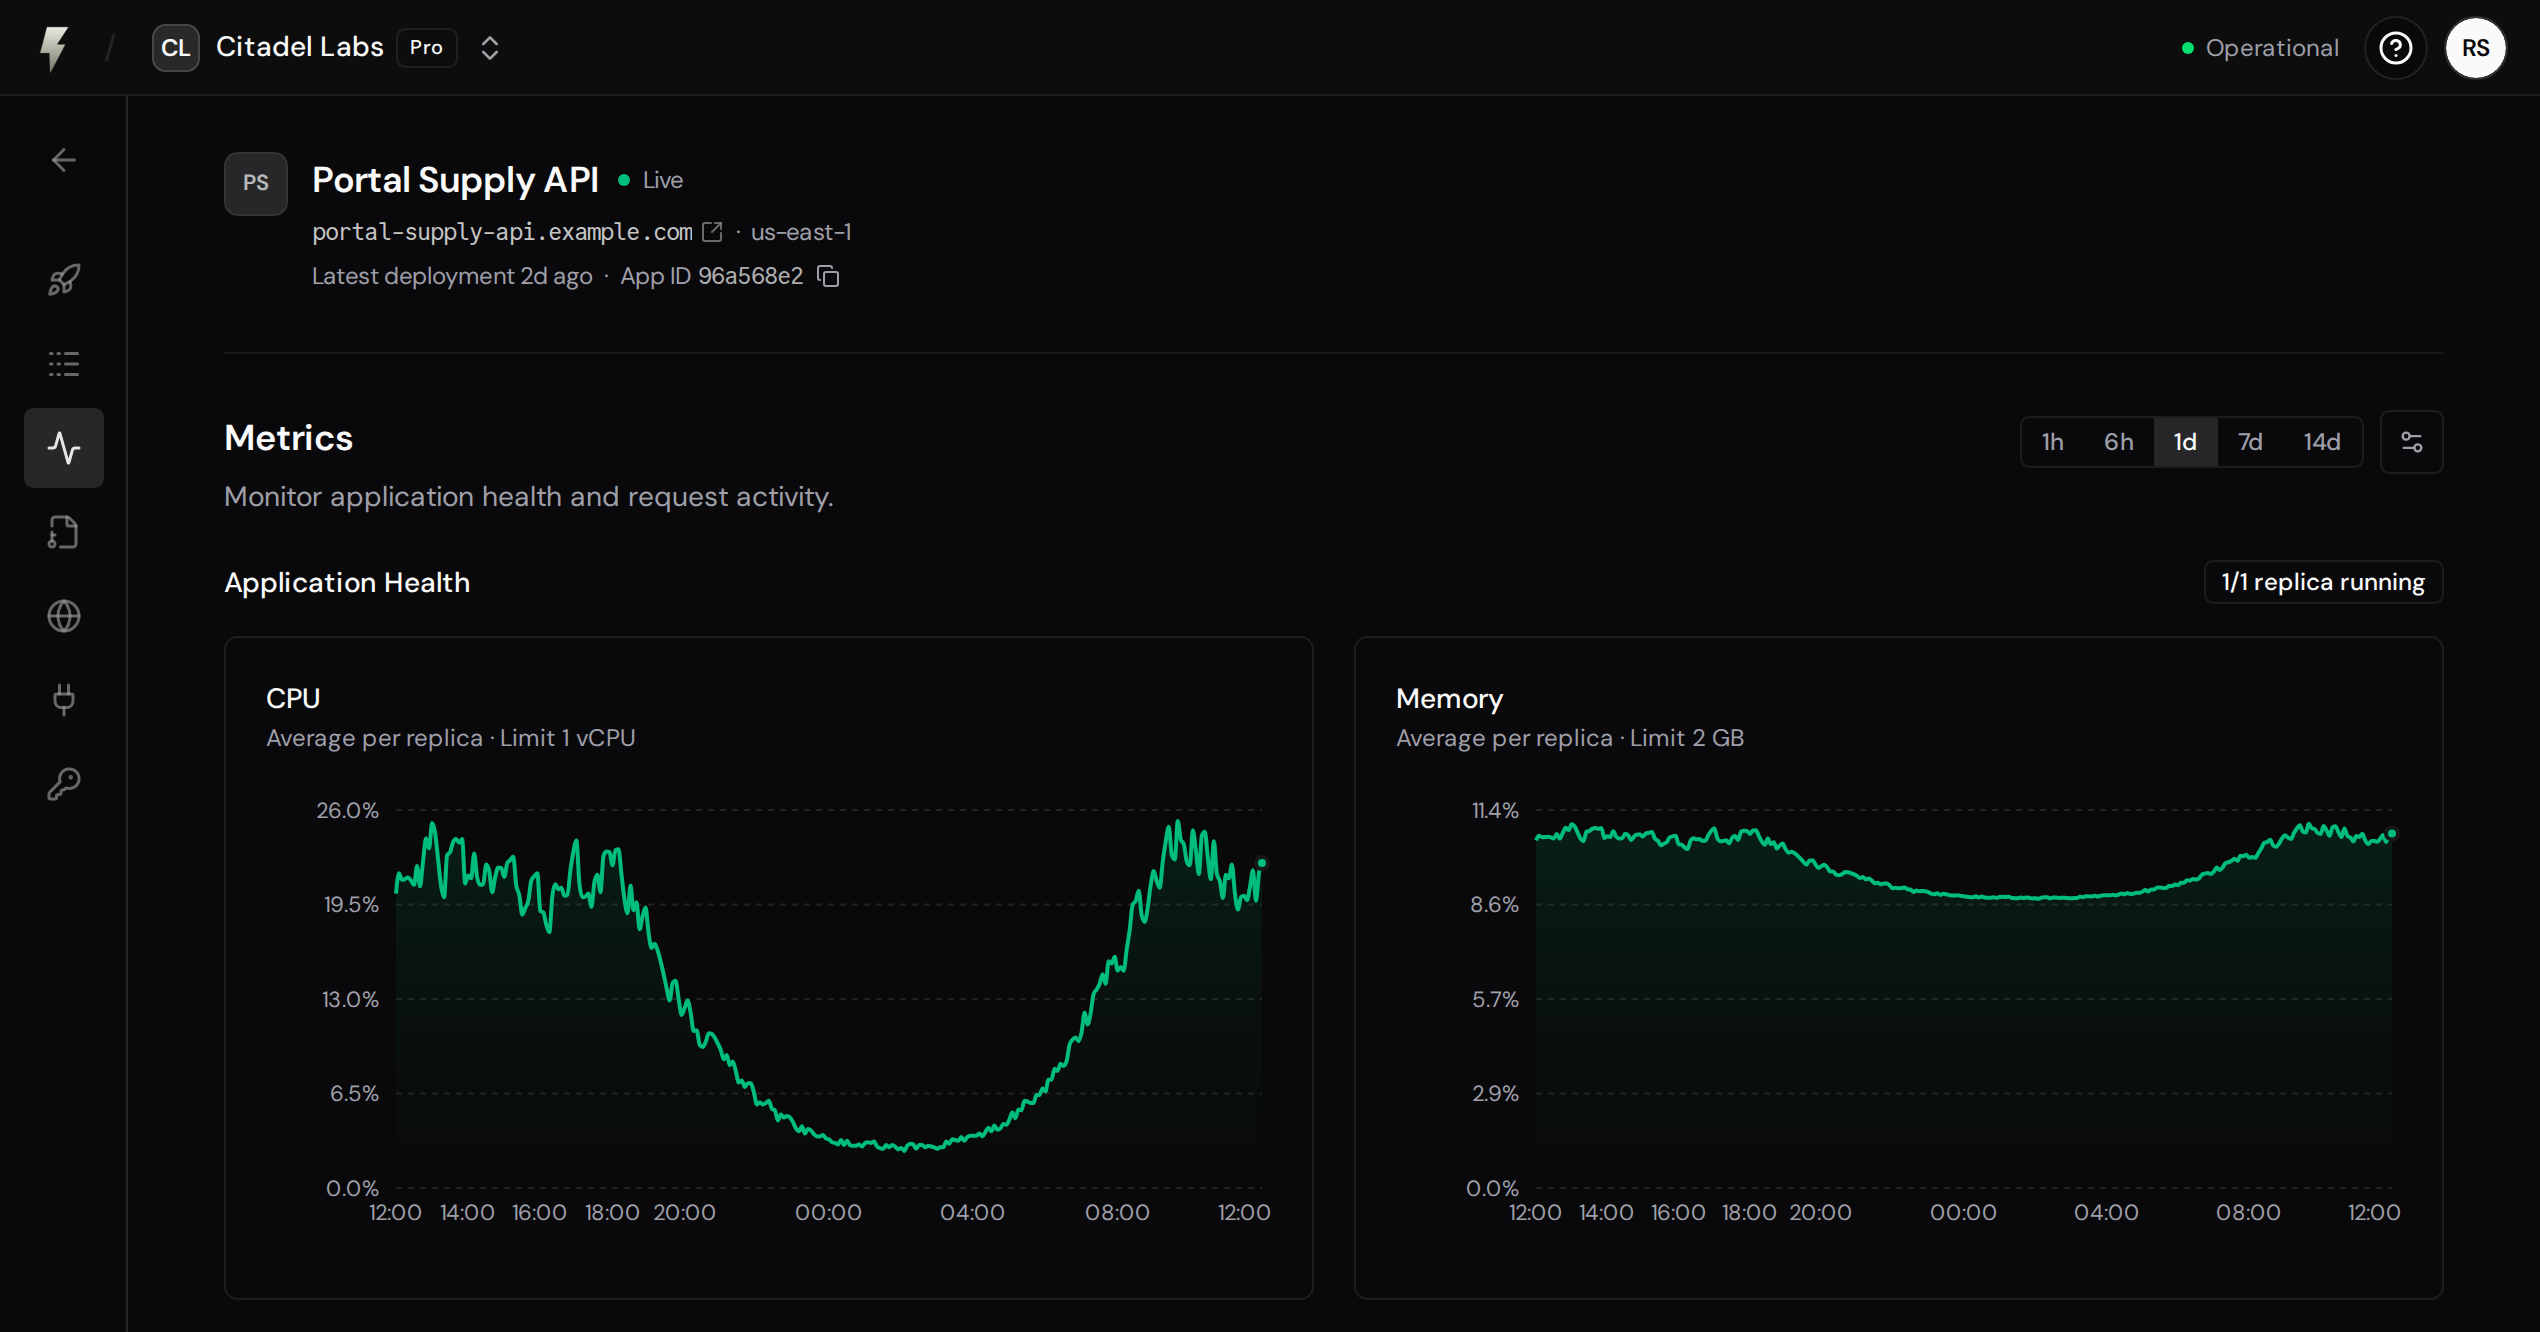
CPU usage in vCPU units, averaged across your app’s replicas. The line indicates the CPU limit per replica. A warning is shown if usage exceeds the limit.
Memory
Section titled “Memory”Memory usage in bytes, averaged across your app’s replicas. The line indicates the memory limit per replica. A warning is shown if usage exceeds the limit.
CPU and memory limits are enforced per app replica. Each replica has its own limits, determined by your app’s instance size.
An individual replica can reach its CPU or memory limit even when the average shown in the chart is below it.
- If a replica consistently approaches its CPU limit, it may experience throttling. Consider optimizing CPU-intensive operations or reducing the work done per request.
- If a replica exceeds its memory limit, that replica will be terminated (OOM killed) and restarted. If you see memory usage climbing toward the limit, check for memory leaks.
Replicas
Section titled “Replicas”The Metrics page shows how many replicas of your application are currently running (for example, “3/3 replicas running”). FastAPI Cloud automatically scales the number of replicas based on traffic, within the bounds set by your app’s Autoscaling settings.
If you see fewer replicas running than expected (for example, “1/2 replicas running”), it usually means a new deployment is rolling out, a replica is scaling up, or a pod crashed and is being replaced. This is typically temporary and resolves on its own. If the issue persists, check your application logs for crash errors or out-of-memory issues.
Activity
Section titled “Activity”Activity metrics are available on Pro plans. They cover request volume, response latency, and per-path breakdowns.
FastAPI 0.142.0 or higher includes OpenTelemetry support. With the standard extras installed, your app sends HTTP metrics to FastAPI Cloud automatically. No custom code or environment variables are needed.
Upgrade FastAPI in your project:
$ uv add "fastapi[standard]>=0.142.0" --upgradeRedeploy your app, then send a request to start seeing activity metrics.
Requests
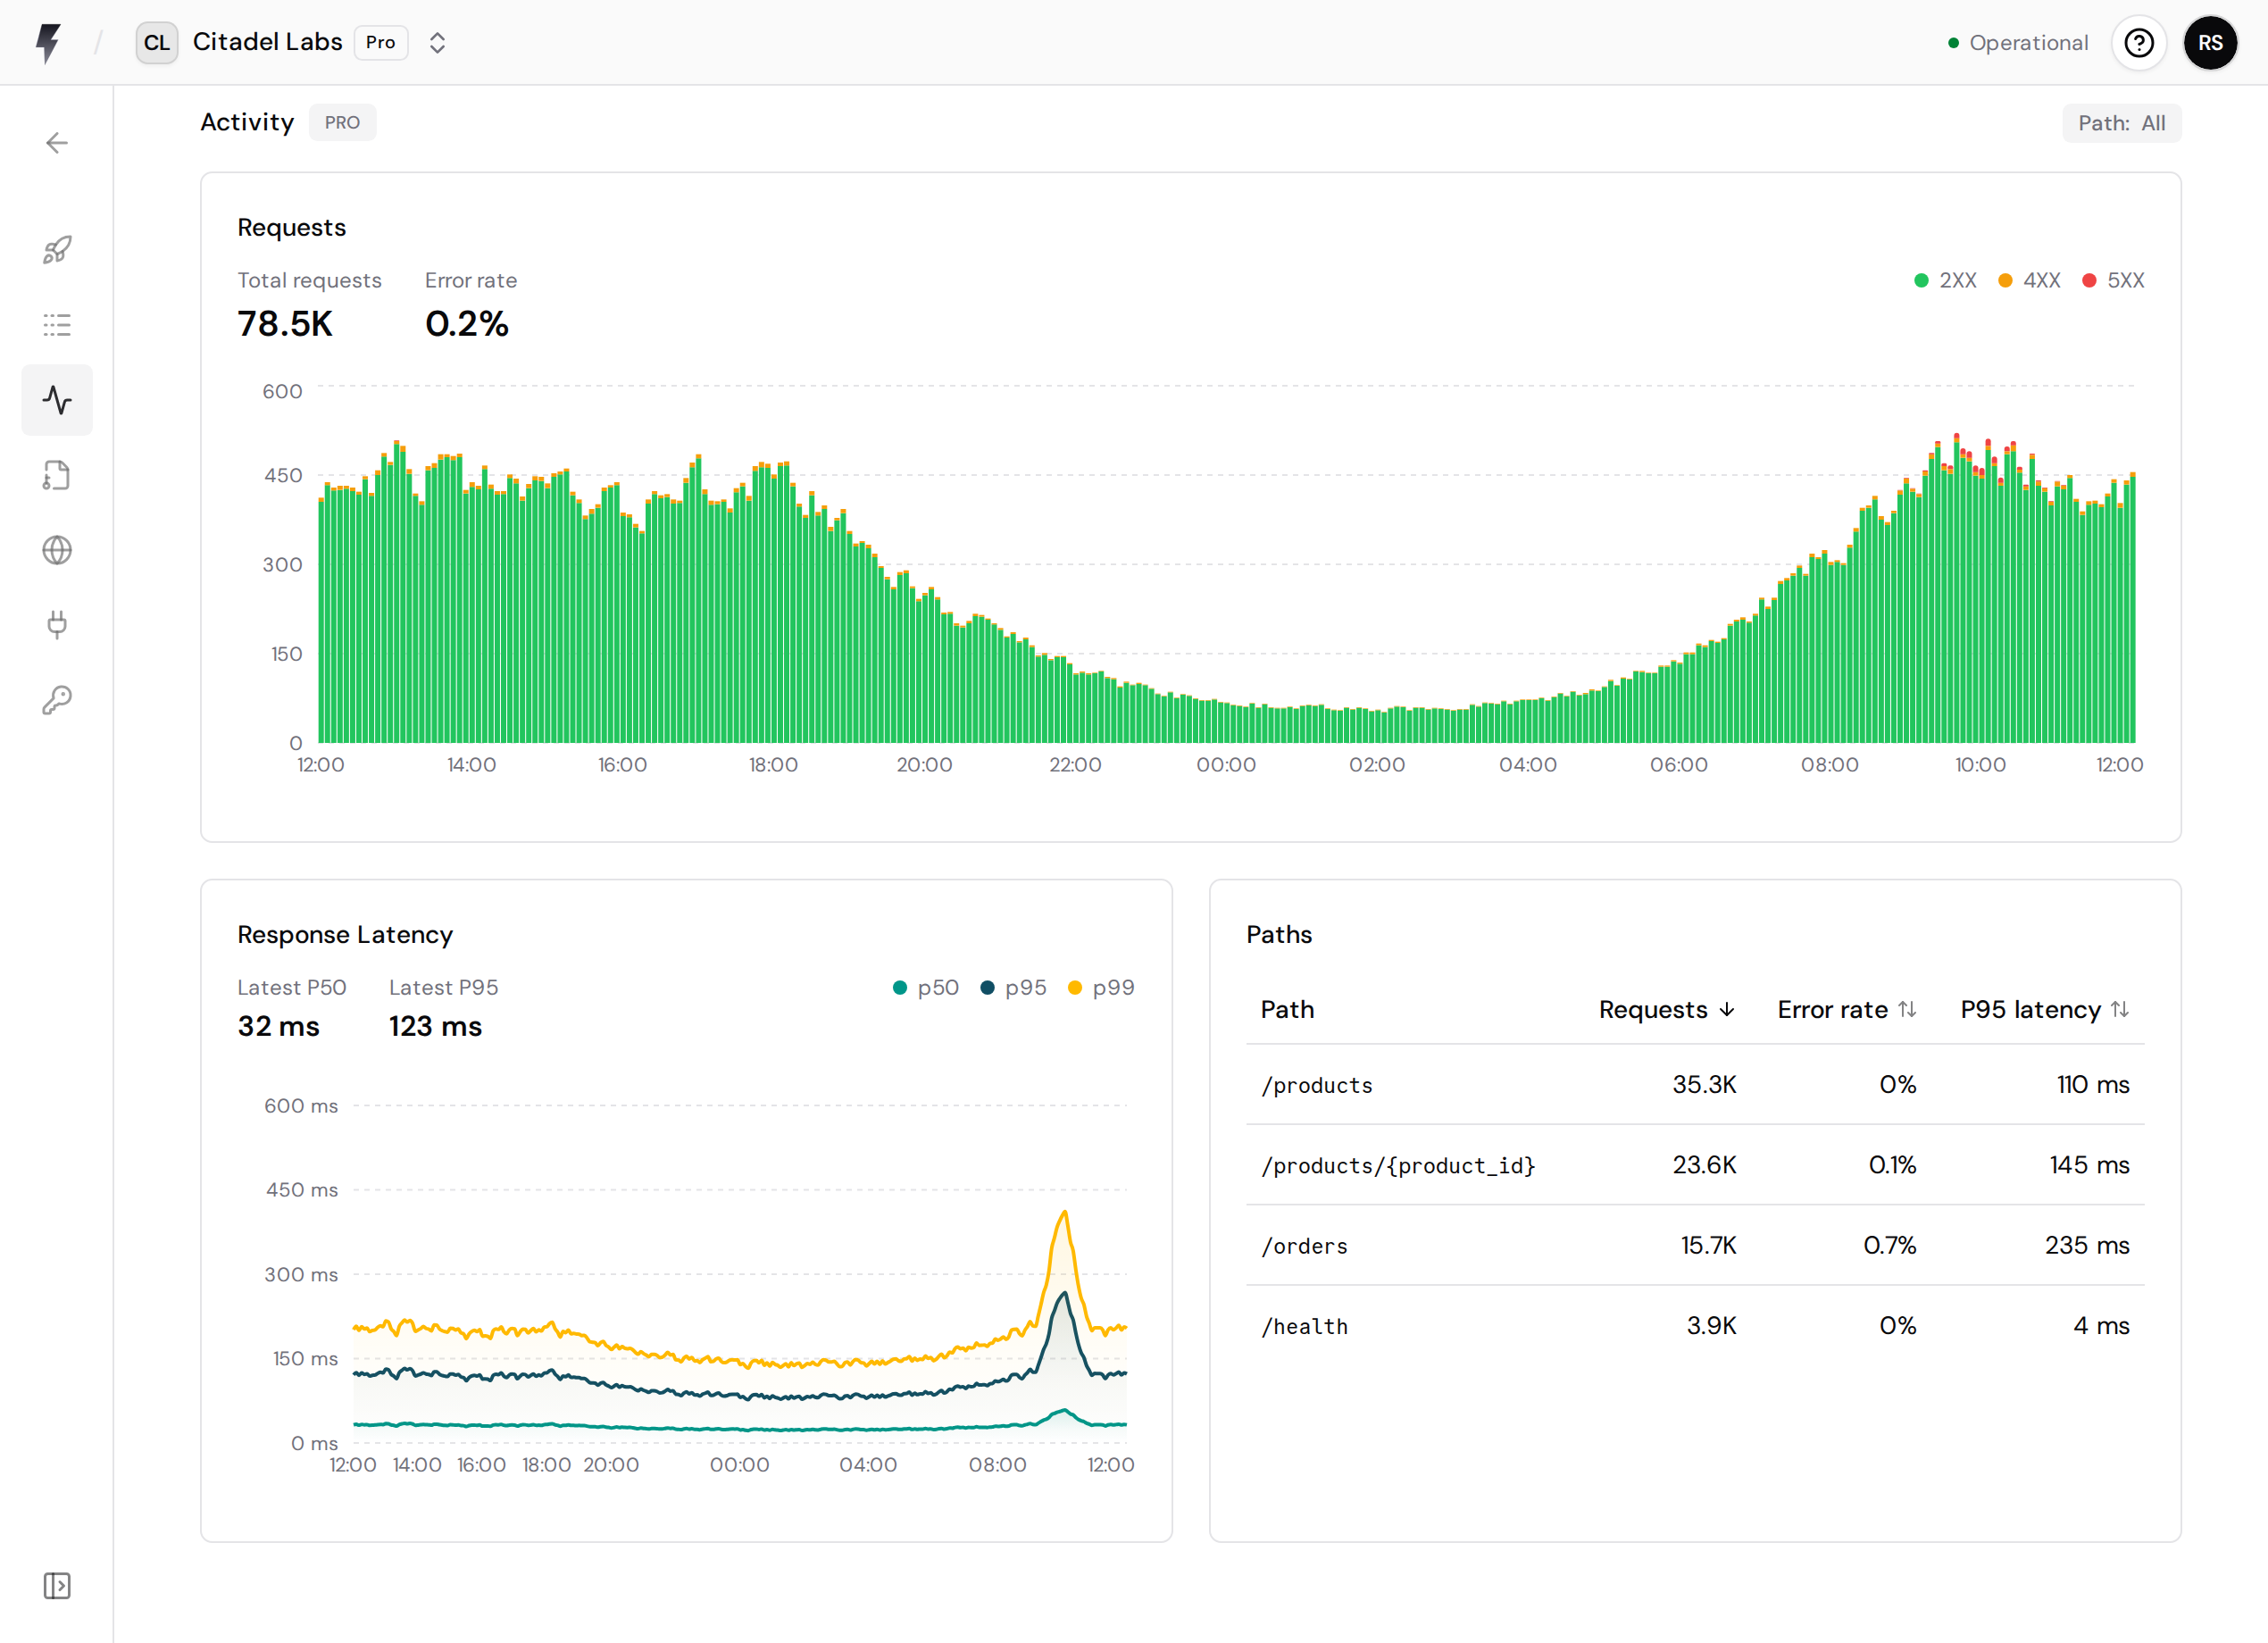
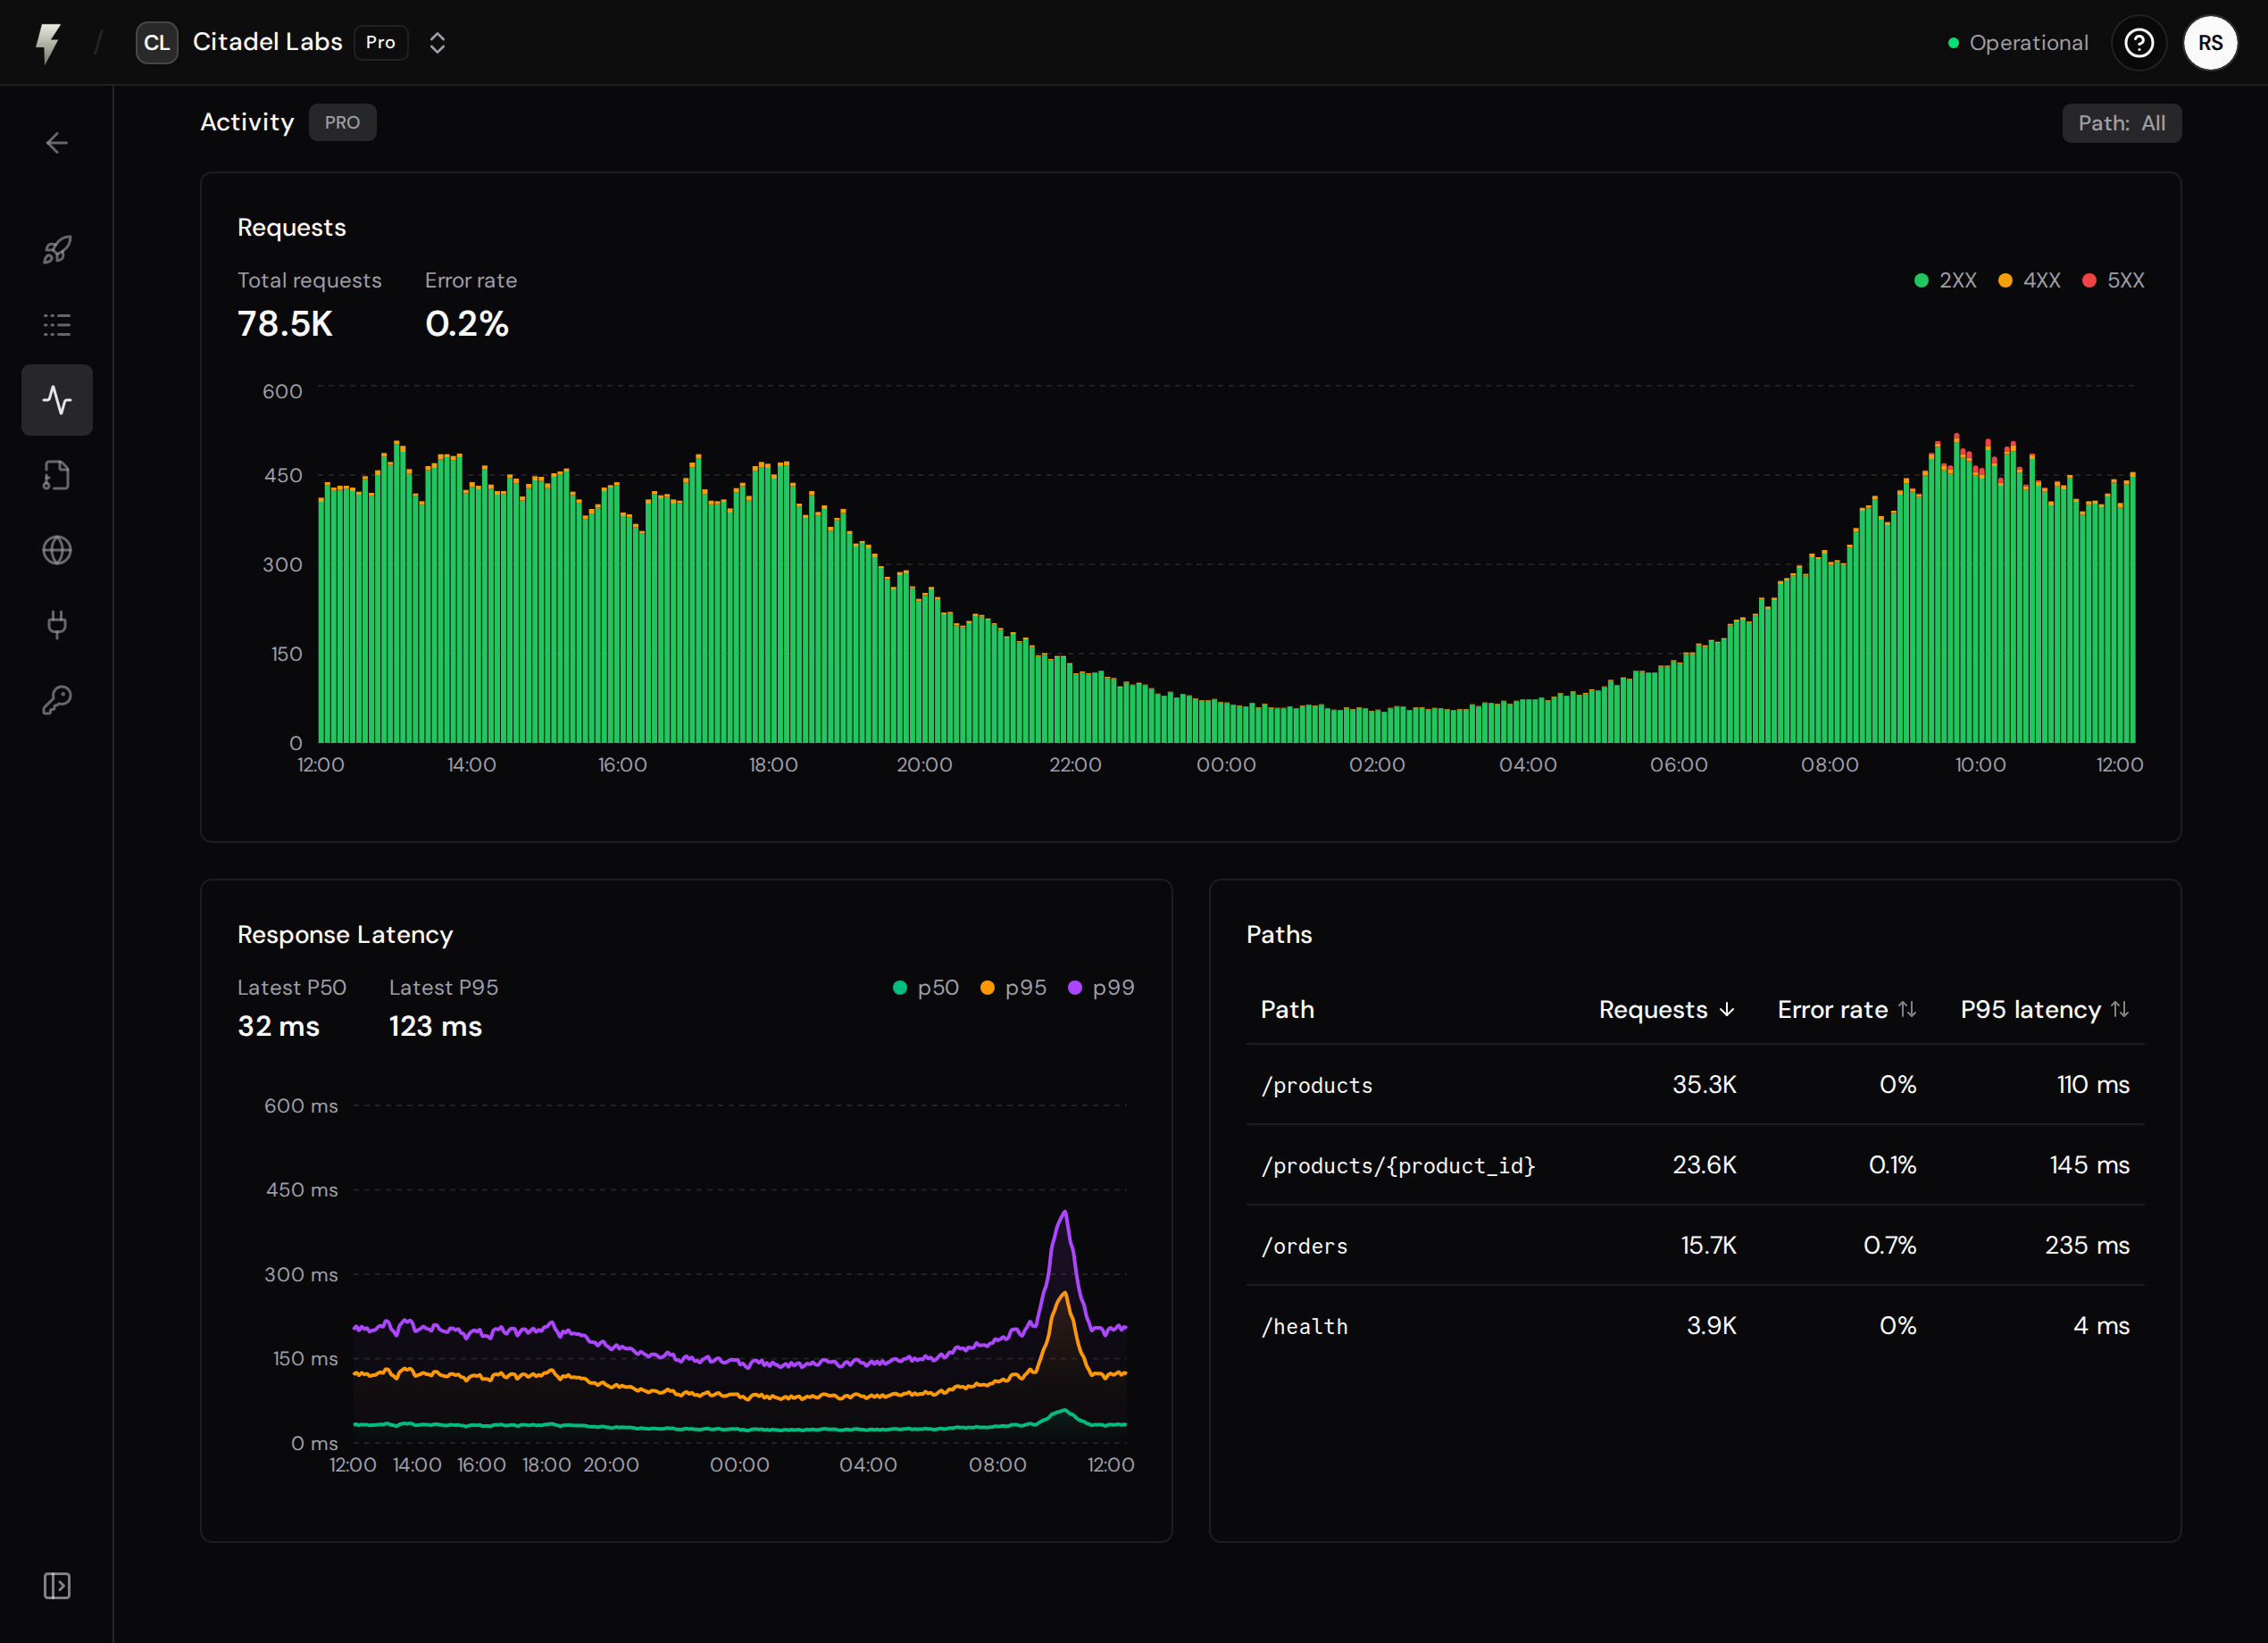
Section titled “Requests”The requests chart shows HTTP traffic to your application as a stacked bar chart, broken down by status code category:
- 2XX (green): Successful responses
- 4XX (orange): Client errors (bad requests, not found, etc.)
- 5XX (red): Server errors
Use this to spot traffic spikes, elevated error rates, or unexpected patterns.
Response Latency
Section titled “Response Latency”The response latency chart shows request latency percentiles over time. Use it to understand whether successful requests are getting slower after a deploy or during higher traffic periods.
Latency is based on successful HTTP responses. Error responses are represented in the requests chart and in per-path error rates.
The Paths table shows which HTTP paths are receiving traffic, their request counts, error rates, and P95 latency for the selected time range. OpenTelemetry groups requests by the matched FastAPI path pattern, not by the raw request URL. For example, requests to /items/123 and /items/456 appear together as /items/{item_id}.
A catch-all such as /{path:path} can therefore combine requests to many URLs into one row. The label is the path pattern from your code, not a URL that someone requested. Mounted applications can group requests in a similar way.
If you want pages to appear as separate rows, define a separate FastAPI path for each page.
Requests that do not match any path are still counted in the Requests chart, but they do not appear in the Paths table. If your app handles unknown URLs with a catch-all path, those requests are attributed to the catch-all instead.
Select a path row to filter the requests and response latency charts to that path. Clear the path filter to return to all paths.
Time Ranges
Section titled “Time Ranges”Use the time range picker to control the window of data displayed across all charts.
- Hobby teams can view up to 1 day of metrics.
- Pro teams can view up to 14 days of metrics.
Chart Controls
Section titled “Chart Controls”- Crosshair sync. To enable crosshair sync, search for the settings button in the top right corner of the Metrics page and toggle the option. When enabled, hovering on one chart highlights the same timestamp across all charts on the page.